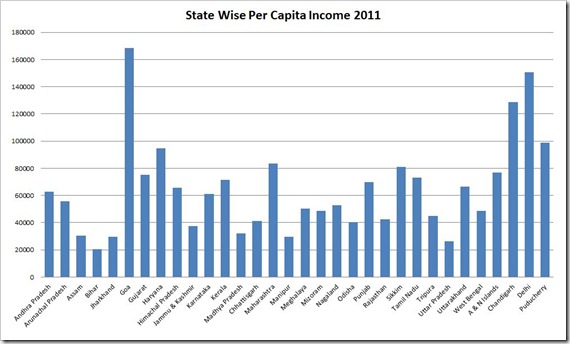
Did you know that Goa has the highest per capita income in India and on the other hand Uttar Pradesh has the lowest!
Ok, if you are confused about what Per Capita income is – here is a short and simple answer. Per capita income is a unit to measure average income of an individual derived from the income of a geography, such as a country or state or city. It is calculated by taking a measure of all sources of income of a geography and dividing it by the total population.
According to the latest figures released by Government – Goa leads the country with per capita income of Rs. 1,92,652/-, while Bihar has the lowest with a per capita income of only Rs. 24,681/-. An average Goan earns 6 times more than an average Bihari!
As per latest 2012 figures, Delhi comes in second after Goa with PCI of Rs. 1,75,812 followed by Chandigarh (1,28,634 – 2011) & Haryana (1,09,227).

India’s
average Per Capita Income is Rs. 60,972/-, which is one of the lowest
in the world. Some European Countries have over 50 times per capita
income as compared to India!
Ok, if you are confused about what Per Capita income is – here is a short and simple answer. Per capita income is a unit to measure average income of an individual derived from the income of a geography, such as a country or state or city. It is calculated by taking a measure of all sources of income of a geography and dividing it by the total population.
According to the latest figures released by Government – Goa leads the country with per capita income of Rs. 1,92,652/-, while Bihar has the lowest with a per capita income of only Rs. 24,681/-. An average Goan earns 6 times more than an average Bihari!
As per latest 2012 figures, Delhi comes in second after Goa with PCI of Rs. 1,75,812 followed by Chandigarh (1,28,634 – 2011) & Haryana (1,09,227).

State Wise Per Capita Income Comparison
| Sl. No | State/UT | 2010-11 (Rupees) | 2011-12 (Rupees) | 2011-12 % Growth |
| 1 | Andhra Pradesh | 62912 | 71540 | 13.7 |
| 2 | Arunachal Pradesh | 55789 | 62213 | 11.5 |
| 3 | Assam | 30569 | 33633 | 10 |
| 4 | Bihar | 20708 | 24681 | 19.2 |
| 5 | Jharkhand | 29786 | 31982 | 7.4 |
| 6 | Goa | 168572 | 192652 | 14.3 |
| 7 | Gujarat | 75115 | N.A | N.A |
| 8 | Haryana | 94680 | 109227 | 15.4 |
| 9 | Himachal Pradesh | 65535 | 73608 | 12.3 |
| 10 | Jammu & Kashmir | 37496 | 41833 | 11.6 |
| 11 | Karnataka | 60946 | 69493 | 14 |
| 12 | Kerala | 71434 | 83725 | 17.2 |
| 13 | Madhya Pradesh | 32222 | N.A | N.A |
| 14 | Chhattisgarh | 41167 | 46573 | 13.1 |
| 15 | Maharashtra | 83471 | N.A | N.A |
| 16 | Manipur | 29684 | 32284 | 8.8 |
| 17 | Meghalaya | 50427 | 56643 | 12.3 |
| 18 | Mizoram | 48591 | N.A | N.A |
| 19 | Nagaland | 52643 | 56116 | 6.6 |
| 20 | Odisha | 40412 | 46150 | 14.2 |
| 21 | Punjab | 69737 | 78171 | 12.1 |
| 22 | Rajasthan | 42434 | N.A | N.A |
| 23 | Sikkim | 81159 | N.A | N.A |
| 24 | Tamil Nadu | 72993 | 84058 | 15.2 |
| 25 | Tripura | 44965 | 50750 | 12.9 |
| 26 | Uttar Pradesh | 26355 | 29417 | 11.6 |
| 27 | Uttarakhand | 66368 | 75604 | 13.9 |
| 28 | West Bengal | 48536 | 55864 | 15.1 |
| 29 | A & N Islands | 76883 | 82272 | 7 |
| 30 | Chandigarh | 128634 | N.A | N.A |
| 31 | Delhi | 150653 | 175812 | 16.7 |
| 32 | Puducherry | 98719 | 95759 | -3 |
| All-India Per Capita Net National | ||||
| Income(2004-05 base) | 53331 | 60972 | 14.3 | |


1 comment:
[url=http://ivlkrwnnz.com]MOxtvtlh[/url] - DSmkCRuhDaSlKFI - http://hhmgziigpu.com
Post a Comment